V8 Exploitation Series - Part 3
V8 Code Base
Introduction
When I started learning about V8 exploitation I thought there would be a guide somewhere that explained the general layout of the code, at least for developers. I was very disappointed when I couldn’t find anything (if you know about something like this could you tell me please!). Thankfully, many of the articles that I read gave me enough pieces to slowly build up an understanding of where to look when I started exploring on my own. There are also plenty of comments left by the V8 team, so I learned how to find the general area of whatever I was looking for, and then read comments until I got to the right spot. I also used the NodeJS V8 docs to help me understand certain structures. This will be a quick summary of the different folders in the src directory, with some opportunities to check out the code yourself to get more comfortable. That being said, I may be wrong about some aspects of the code. I have worked very hard to try and validate everything in this post, but I may have incorrect assumptions. The code is also likely to change, so I will attempt to talk about locations in general without referring to specific function names. If you notice any mistakes, please reach out to me.
Another thing that really helped me out was starting smaller. I went from knowing nothing about JS engines to trying to find bugs in one of the most complex ones out there. Once I took a step back and tried looking at other JS engines, I learned more about the general concepts that are also present in V8. Specifically, I learned a lot about JS engine layouts through CTF challenges related to MuJS, which is also open source.
Installing the Code
You can find the installation instructions here. Or see my abbreviated code below, which also includes the debug build.
Disclaimer: These may change/not work due to dependencies missing in your environment. Refer to the V8 documentation for the most up-to-date guide. These commands were run on Ubuntu 20.04.
1
2
3
4
5
6
7
8
9
10
11
12
# V8 Source
git clone https://chromium.googlesource.com/chromium/tools/depot_tools.git
export PATH=/path/to/depot_tools:$PATH
gclient
mkdir ~/v8
cd ~/v8
fetch v8
cd v8
git pull
gclient sync
tools/dev/gm.py x64.release
tools/dev/gm.py x64.debug
The instructions linked above briefly mention downloading Visual Studio. I highly recommend following the instructions here for creating your setup. For example, I’m using VSCode, which allows you to quickly jump to references between functions. This is extremely useful for debugging.
This would be a great time to grab a cup of coffee because building is going to take a while. In the meantime, I recommend watching this presentation (slides) to get an idea of how V8 processes scripts.
Now let’s check out some of the important folders under v8/src/.
Directory Breakdown
d8
Compiling locally outputs a binary called d8. It is a very lightweight wrapper for V8, and it saves you the trouble of making your own. If you are interested in that, I’d recommend checking out the other half of this series.
As I mentioned in the my last post, V8 is usually embedded within another application, so we need to launch an isolate to run our JavaScript. d8 does this in d8/d8.cc through V8’s API calls, and a bunch of other setup for the REPL. Looking at all of the code in the folder a bit more, you will see references to Fuzzilli as d8 includes many features to support this framework, as well as other testing tools employed by Google. It’s important to understand this binary if you’re thinking about adding support for more test systems or extending the shell in some way.
Also, you can get some good experience by running the d8 binary under GDB. For example, you can walk through the startup process by breaking at main, or set breakpoints on other interesting functions and using backtrace to examine the call chain. It is located at out/x64.[release||debug]/d8. Both versions have symbols, but the debug binary also lets you see the source from within GDB.
api
A lot of things happen when we start a V8 isolate. It has to initialize its heap, components (like Ignition and Turbofan), and everything else that goes into getting the execution environment ready. The api folder exposes endpoints to the embedder to start this process, as well as other functions that are useful after startup.
Per the V8 docs:
The V8 API provides functions for compiling and executing scripts, accessing C++ methods and data structures, handling errors, and enabling security checks. Your application can use V8 just like any other C++ library. Your C++ code accesses V8 through the V8 API by including the header include/v8.h.
Here is an example from the repo on using V8 to run JavaScript from an embedder. I will reference some of these API calls later on.
1
2
3
4
5
6
7
8
9
10
11
      // Create a string containing the JavaScript source code.
      v8::Local<v8::String> source =
          v8::String::NewFromUtf8Literal(isolate, "'Hello' + ', World!'");
      // Compile the source code.
      v8::Local<v8::Script> script =
          v8::Script::Compile(context, source).ToLocalChecked();
      // Run the script to get the result.
      v8::Local<v8::Value> result = script->Run(context).ToLocalChecked();
      // Convert the result to an UTF8 string and print it.
      v8::String::Utf8Value utf8(isolate, result);
      printf("%s\n", *utf8);
init / base
So how does V8 actually complete these startup tasks? Most of that functionality is located in the init and base folders. init/v8.cc is a good place to look for tracing the initial path taken when V8 gets going. However, the base folder contains much more code, and does a lot of the actual initialization work.
codegen
When the embedder wants to run some JavaScript, it makes a call to the Compile API function. The codegen folder holds the functionality for using Ignition or Turbofan to compile and return a pointer to the generated code. It is also responsible for collecting compilation statistics and reporting that information.
execution
Personally, I thing execution.cc would have been a good name for the garbage collector (dumb joke, sorry). However, it is actually the code responsible for running scripts. The embedder makes a separate call to run the code that was created from compiling the JavaScript. This means creating the memory regions to map executable and code and execute it. If you’re looking to trace execution through this step, look into compiler.cc.
interpreter
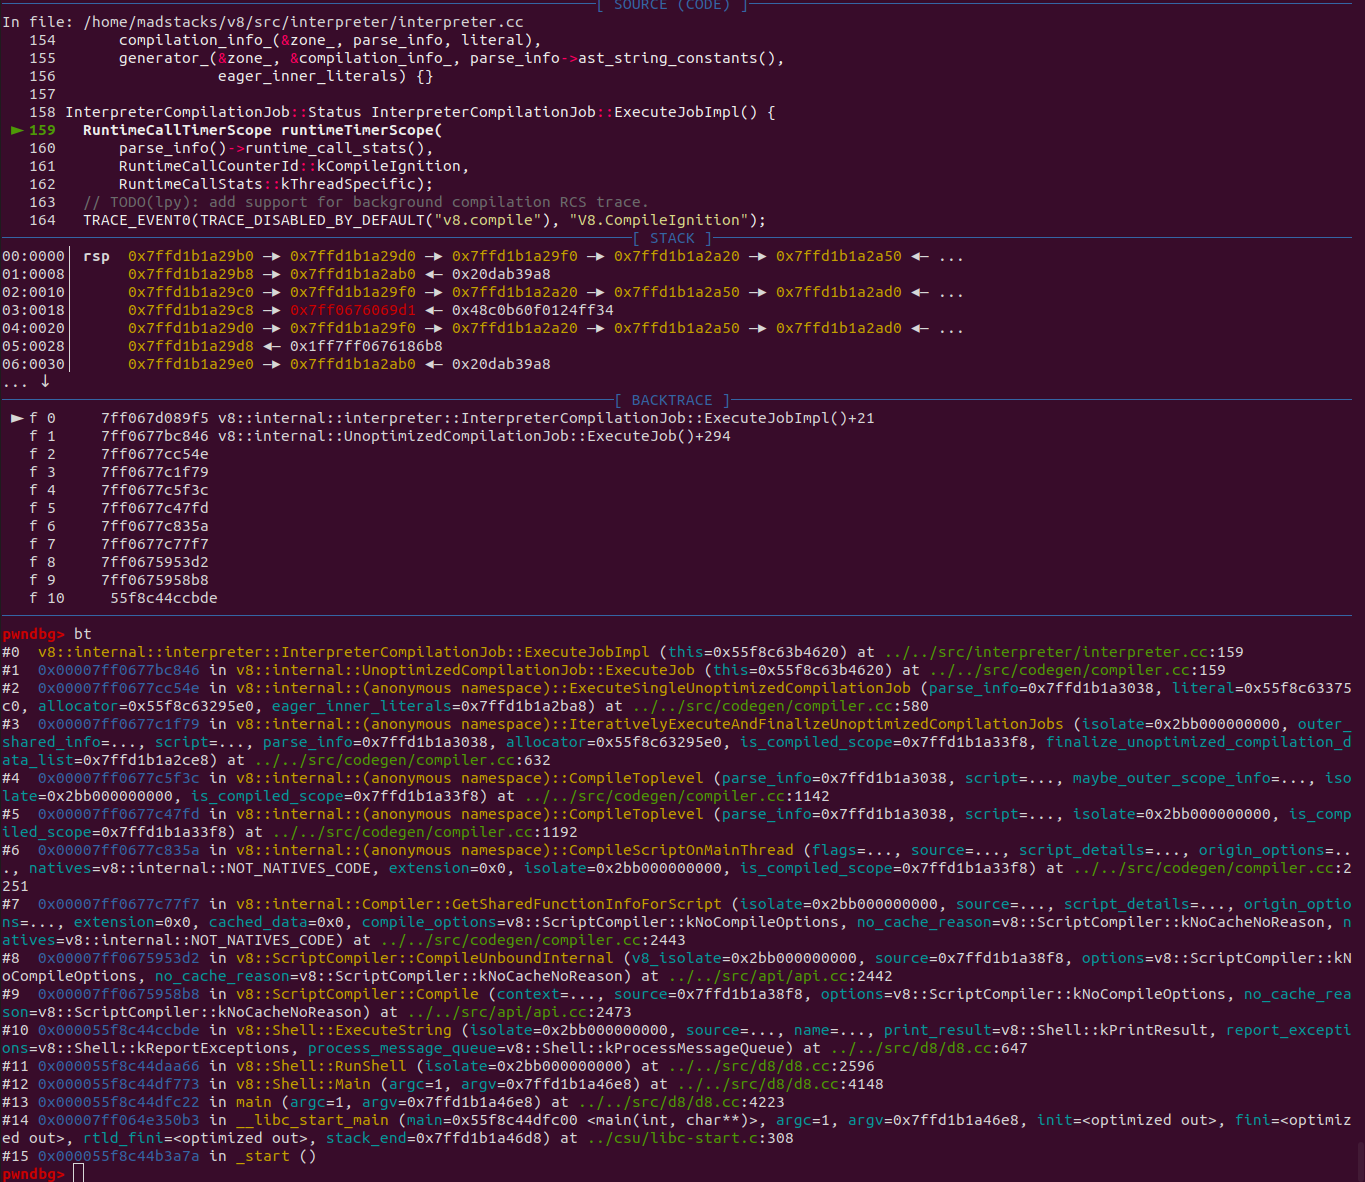
As the name suggests, this folder contains the functionality for Ignition; however, note that some of what goes into generating bytecode is in other locations (such as the parser). interpreter.cc has the overall logic, but you can get deep into the specifics and find the logic for instructions, register selection, scheduling, etc.
If you want to examine how a particular script gets interpreted, you probably will want to use some of the debugging features built into d8 (which I will talk about in my next post). However, you can use GDB to look at the call chain if you are interested in hooking specific parts of the bytecode generation. Here I simply did a backtrace showing how the interpreter is reached during the Compile call.
compiler
Again, the name here is very helpful, we know that this is the directory for Turbofan. My next post will go a lot more in-depth on this code.
common
This folder contains an interesting file, globals.h, which stores constant values related to the size of different types. Many of these will come up again when talking about Turbofan.
torque / builtins / objects
Many of the .tq (torque) files are located in the builtins and objects directories. These are the implementations for commonly used functions that are specified by ECMAScript.
The torque folder itself is in charge of doing the things listed in the Torque documentation. It is a separate binary that is used to generate code from .tq files. The main function is in torque.cc if you need to trace the execution path.
flags / runtime
The flags directory specifies optional flags that can be passed to V8, which you can set using d8. One flag that we will use a lot is --allow-natives-syntax, which will enable us to call certain functions from within our JavaScript code. V8 has many runtime functions that are good for debugging. These are defined in runtime/runtime.cc and implemented in the same folder.
wasm
Honestly, I do not have a lot of experience with WebAssembly as it relates to V8. However, I am pretty sure that this folder is the “Liftoff” component based on the name. We will talk more about this in a later post as I get a chance to look into it more.
Conclusion
The purpose of this post is to get you more comfortable with the V8 code base, which can be overwhelming due to its size. There are still many, many more things that could be said about the code, but having a general idea where components are, some of the important names, and experience with stepping through various functions will all make future exploitation much more comfortable to learn.
As I mentioned earlier, it would be impossible and unnecessary to fully go through the code at a singular moment in time. The best course of action when you have a question is to checkout the code, refer to comments or any documentation, set a breakpoint on an important function, look at the backtrace, and go from there. Next, we will start using some of Google’s tools for debugging to look at the interpreter and compiler.